
Let me tell you two different stories.
A trader watching the market moves faster than his eyes and hands. He knows one late click will miss the chance.
At the same time, a startup founder decides to build a new trading product. Initially, he thought it was a “good idea”, then he came to know that future users are already using apps powered by silent algorithms that run 24/7.
Both of these cases are ignoring something important. It’s an algorithm trading strategy.
It helps traders to protect their emotional decisions, records each move before humans notice, and tests their ideas safely.
For a founder, these strategies can help them build trust, earn profits, and truly be competitive in the AI-driven market.
Let’s look at those 10 smart algo trading strategies that are going to change the way of trading and business growth.
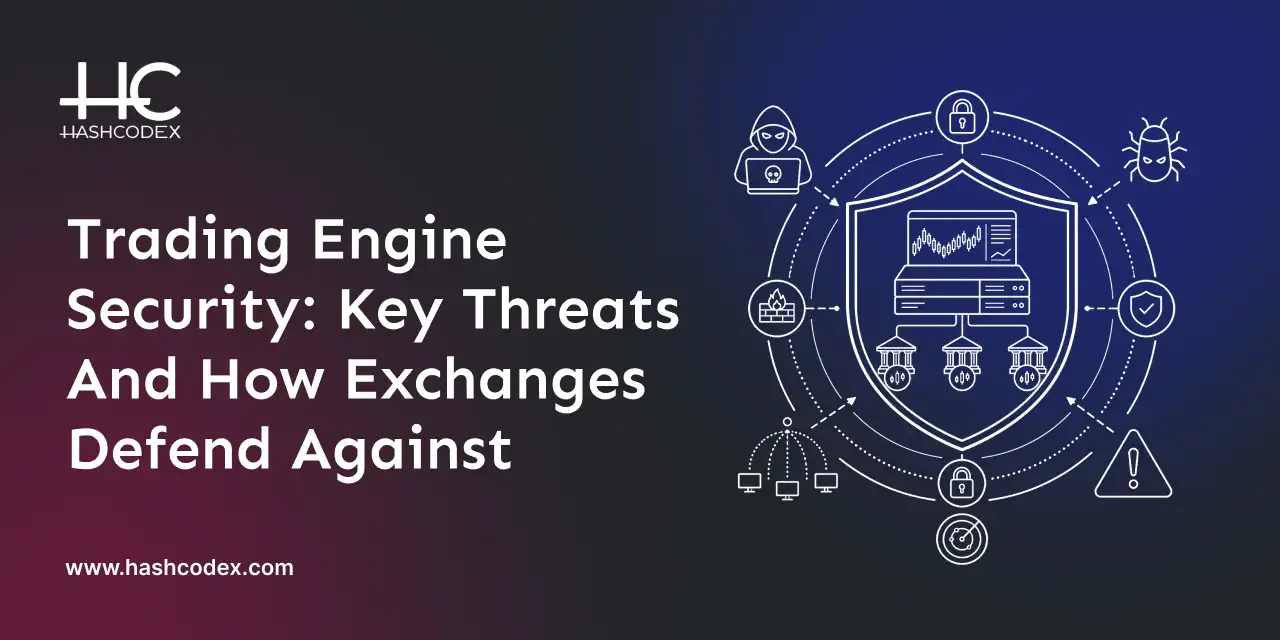
Understanding Algorithmic Trading
Algorithmic Trading uses computer programs to execute trades automatically at high frequency and speed, which is impossible for humans. These algorithms are used to carry out advanced trading strategies, improve market liquidity, and reduce human emotional decisions. It can also analyze spot patterns, prices, and perform trades within seconds.
This algorithm trading gives more benefits, like performing trades faster, making decisions based on pre-determined rules, and monitoring several metrics and markets at the same time. Here’s an example for you:
You can set a rule like “If the price falls to 3% in one hour, then buy Bitcoin automatically”. You don’t need to sit and watch the chart. The algorithm keeps checking the price every second. Once the rule is true, the system buys Bitcoin instantly even if you’re offline.
Top 10 Algo Trading Strategies Every Startup Founder Must Know Before 2026
Algo trading strategies usually depend on pre-defined rules, algorithms and technical indicators to execute trades in different markets. Here are 10 main strategies that every startup founder should know in 2026:
1. Trend Following
This strategy uses algorithms to automatically identify and earn profit from the existing market trends by assuming they will continue. It doesn’t predict future market moves; instead, it responds to price action using tools like moving averages to confirm the direction of the trend.
How it works
- Identify trends: The algorithm uses technical indicators like moving averages and examines past price data to figure out whether the market is rising or falling.
- Take action: If the price moves upwards, the algorithm will buy the asset. If the price goes down, the algorithm sells the asset.
- Stay in trade: As long as the trend continues, the algorithm holds the position.
- Exit the trade: When a pre-set risk management, like stop-loss, is attained or the trend indicates signs of ending, it exits the position.
Main indicators:
- Moving Averages
- Average Directional Index
- Moving Average Convergence Divergence
- Relative Strength Index
- Bollinger Bands
Example
When the 5-day average is increasing and a stock breaks over a high volume, the algorithm will buy automatically. The 50-day average will then be used as a moving stop-loss, so if the price drops back below it, the trade will close to protect profit.
2. Mean Reversion Strategy
A mean reversion strategy is a trading approach that assumes prices will return to their normal level if the prices move too far in one direction. So, if a price falls too below normal, the strategy buys with the expectation that it will rise again. When the price increases too high, it sells by assuming that it will drop again.
How it works:
- Find the mean: Start by identifying the asset’s historical average price, that usually done with an Exponential Moving Average (EMA) or Simple Moving Average (SMA).
- Detect deviation: Next, the algorithm tracks the price moves above or below the average to find when it deviates greatly from this mean.
- Create trade signals: When the price drops too low, it will show a buy signal and expect it will rise back to the average. When the price rises too high, it will show a sell signal by expecting it will fall back.
- Place and close trades: Based on the signal, the algorithm buys or sells an order and closes the trade once the price returns or hits the exit point.
Main indicators:
- Bollinger Bands
- Moving averages
- RSI
- Stochastic Oscillator
Example
If a stock trades 10% above its 20-day moving average, the algorithm will sell it, expecting the price to fall back to the average. If the price drops too low below the average, the algorithm will buy.
3. Arbitrage strategy
This strategy allows traders to buy and sell the same asset in different markets at the same time using automated software. It is a safe strategy because it executes the trades at the same time by locking profit based on the price difference.
How it works:
- Find a price gap: The algorithm tracks different exchanges that have different prices for the same asset.
- Trade both at once: It buys the asset on the cost-effective exchange and sells it on the expensive exchange at the same time.
- Earn the difference: Traders can earn profit from the price gap. They’ll get profits from the higher selling price minus the lower buying price.
- Improve the market: The price gap could be reduced when many algorithms start to do this, which makes the market more balanced and efficient.
Main indicators:
- API access to multiple exchanges
- Price comparison bots
- Arbitrage scanners
- Latency-optimized trading infrastructure
Example
If Reliance stocks are trading at ₹2,400 on the NSE and ₹2,410 on the BSE, the algorithm will purchase on the NSE and sell on the BSE all at once, which gives you a profit of ₹10.
4. Breakout Strategy
The algorithm enters a trade when the price moves beyond a key support or resistance level, signalling the start of a new trend. It automatically executes trades based on pre-determined factors like price rise for a long position or below a support level.
How it works:
- Mark price zones: It begins by finding the support and resistance levels or a tight price range on the chart.
- Wait for a breakout: It keeps monitoring until the price transparently moves above the resistance level or below the support.
- Confirm the move: The system checks for strong indications like high volume or other assuring indicators to avoid fake breakouts.
- Enter the trade: When the price breaks, close above a resistance level for a long (buy) trade, and close below a support level for a short (sell) trade.
- Control risk and profit: Stop-loss means buy trade below the breakout and sell it above the breakout. Set using tools like existing price levels or ATR, to exit once the trade makes a profit.
Main indicators:
- Volume (On-Balance Volume or spikes)
- Momentum indicators (MACD, RSI)
- Volatility indicators (Bollinger Bands)
- Moving averages
- Support/resistance levels
Example:
When the price closes above the previous resistance level, an algorithm trades a stock within a range and enters a long position. In this case, the stop-loss is set just below the breakout point.
5. Scalping Strategy
This strategy involves a computer program that executes a huge volume of short-term trades to profit from a small price movement in high liquidity markets. This algorithm enters and exits a position within seconds or minutes.
How it works:
- Technical analysis: It uses technical indicators like moving averages or oscillators to find patterns and potential entry/exit points on short-term charts.
- Risk management: If the price moves against the algorithm, tight stop-loss orders automatically exit a trade to prevent large losses on any single trade.
- Trade execution: When it attains a certain condition, the algorithm buys and sells quickly to profit from a small price increase.
- Market monitoring: The algorithm continuously monitors real-time data to identify new opportunities and manage existing positions.
Main indicators:
- Tick charts
- Level 2 market data
- Direct market access (DMA) trading platforms
- Volume profile tools
Example
It creates a rule-based strategy using technical indicators like moving averages. That strategy is to buy when the short-term moving average crosses above a long-term one, then sell instantly.
6. Market Making Strategy
A market-making strategy in algo trading is an automated strategy used to offer liquidity to a market by simultaneously trading for financial tools and profiting from the difference. This algorithm is used to keep updating the quotes, manage risk, and execute trades to ensure buyers and sellers can execute orders.
How it works:
- Provide liquidity: The algorithm performs buy and sell orders for a particular asset to create a market for it and ensure it is available for other traders.
- Profit from the spread: Bid-ask spread is the difference between the highest price a buyer wants to pay (bid) and the lowest price a seller is willing to accept (ask) to get a profit.
- Trading at the same time: This strategy involves buying the asset at a bid price and selling it at an ask price to grab the spread.
- Automated execution: Algorithm uses high-frequency trading to continuously adjust the buy and sell prices based on market conditions like volume, volatility, and liquidity.
- Risk management: Market makers should handle two key risks: price risk and inventory risk.
Main indicators:
- Moving Averages
- Volume-Weighted Average Price (VWAP)
- Average True Range (ATR)
- Relative Strength Index (RSI)
Example
If an algorithm is set to act as a market maker for a particular stock, it is coded to always have a standing order to buy at $10.00 and to sell at $10.05.
7. Momentum Strategy
In algorithmic trading, a momentum strategy aims to benefit by purchasing assets with a recent high price performance and selling those with a recent low performance by expecting that recent trends will continue. The key principles are "buy high and sell higher" or "sell low and cover lower".
How it works:
- Figure out the trend: Assets that show upward or downward momentum over a given look-back period, such as days or months, are identified by an algorithm.
- Perform trades: Assume that the trend will continue, it purchases assets with high upward velocity and sells those with high downward momentum.
- Check for modifications: The algorithm keeps a check on the trend and exits a trade with momentum turns around or declines.
- Capital rotation: This strategy’s rapid rotation of capital from assets that lose momentum to new ones that have started to trend upward.
Main indicators:
- RSI
- Moving Average Convergence Divergence (MACD)
- Breakout scanners
- Volume indicators
Example
An algorithm buys a stock after it breaks above its 20-day high, assuming the upward momentum will continue.
8. News-Based Trading Strategy
These strategies can automatically execute trades according to preset rules after using computer algorithms to evaluate current news and market sentiment. These algorithms take advantage of short-term market pricing errors caused by news events by analyzing and taking action on information much faster than a human trader.
How it works:
- Data transmission: For relevant data, the algorithm continuously searches social media, news feeds and other sources.
- Sentiment analysis: The system examines the text using natural language processing (NLP) to determine the overall tone.
- Rule-based implementation: The algorithm makes trades according to a pre-programmed strategy based on the news and its mood.
- Momentum trading: This strategy usually takes advantage of the algorithm’s detection of a stock’s potential to keep moving in the direction suggested by the news.
Main indicators:
- NLP models
- Sentiment score
- Economic data releases
- Earnings announcements
- Corporate news
Example
After a positive news release, such as favourable government policies, an algorithm automatically buys a company’s stock immediately.
9. Day trading strategies
Day trading strategies in algo trading use computer programs to execute trades automatically based on predefined rules. These algorithms can capitalize on intraday market opportunities by removing human emotion and executing at high speeds.
How it works:
- Create a strategy: Set clear, predefined standards for initiating and ending trades as part of your day trading strategy. Numerous inputs, such as price, volume, time, or technical indications, can act as the basis for this.
- Build the algorithm: It could be necessary to use a brokerage API to connect to the exchange to program these rules into a computer algorithm.
- Describe risk management: Include risk management rules, including stop-loss orders, which automatically leave a trade to reduce possible losses.
- Run the algorithm: Real-time market monitoring is done by the algorithm, which runs continually.
Main indicators:
- Breakout Momentum
- Moving Average Crossovers
- Relative Strength Index (RSI)
- Average Directional Index
Example
It acts like a breakout bot that buys a stock when the price breaks above the day’s high with strong volume and exits when a quick profit target is hit.
10. Index fund rebalancing
This strategy depends on the predictability of index rebalancing events, such as changes in the weighting or composition of stocks in an average index like the S&P 500 or the Nifty 50. The index fund, which aims to replicate any benchmarks, should purchase or sell shares whenever the index changes, which may happen quarterly or annually.
How it works:
- Identify probable index changes: When the index is updated, the algorithm looks at factors like market capitalization size to predict which stocks could be added or eliminated.
- Expect fund responses: Following the update, it estimates how index funds and large investors will purchase or sell those equities.
- Make an early trade: Before the news is official, the algorithm purchases stocks that are expected to be included and sells stocks that are likely to be deleted to profit from the subsequent price movement.
- Continue to follow the index: The ultimate goal is to maintain the portfolio's connectivity to the index to prevent results from deviating from the benchmark.
Main indicators:
- Historical rebalancing data
- News/data APIs
- Index rebalancing calendars
- Order flow analysis tools
Example
There will soon be a new stock added to the Nifty 50. The algorithm purchases it rapidly and believes that the index funds will need to purchase a huge quantity, causing the price to rise.
Is Algo Trading Software Development a Profitable Business in 2026?
Yes, developing algo trading software can be a profitable business in 2026. More investors and traders depend on automation and AI to make better decisions. This promotes the demand for reliable, customizable trading algorithms that keep growing. Even retail traders are interested in using this platform because it helps them compete with big institutions.
If you’re an entrepreneur, you can build a software that today’s traders want, which is fast, secure, accurate and user-friendly. There’s a big opportunity waiting for you to earn strong profits in future and beyond.
Conclusion
Whether you’re a trader or a founder, keep in mind that you’re competing with a machine.
The traders who still depend on manual clicks will regret it later, and the founders who miss the automation are making the way to their competitors.
Algo trading is not about faster trades; it’s about controlling your emotions and making smart decisions. By knowing these strategies, you’re now having a blueprint of how future markets actually work.
Still asking: “Should I care?” Yes, you should.
At Hashcodex, we specialize in algorithmic trading development services to clients from all over the world. We stand out because of our honesty and dedication to every project we take on. Our developers are experienced and have a good rapport with you from the beginning. We help you implement these strategies into your platform and support you till the end.
Stop thinking and let’s start your project soon!