
Are your platform users struggling to analyze market trends easily?
Many startups lose active traders because of poor chart experiences.
For example, during sudden crypto price movements, slow charts can delay trading decisions and frustrate users.
As a result, traders often move to platforms with faster and more advanced charting systems.
Today’s traders expect real time data, technical indicators, multiple chart views, and interactive drawing tools.
Custom trading charts help improve user experience and platform performance.
They also help build trust and keep traders engaged for longer periods.
In this blog, you will learn what trading charts, how modern trading charts work and why advanced charting solutions are important for trading platforms.
What Are Trading Charts and How Do Modern Trading Platforms Use Them?
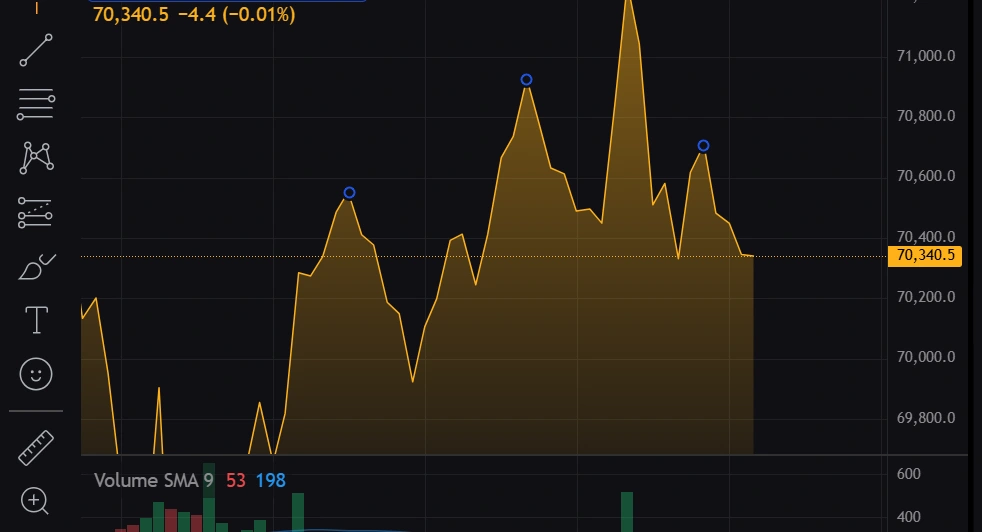
Custom trading charts are interactive charts used in trading platforms to display real-time market prices, historical data, and technical analysis indicators. These charts help traders analyze market trends, track price movements, and study trading patterns in forex, cryptocurrency, and stock markets.
Modern trading platforms use custom trading charts to help traders monitor market activity and analyze trading data. These charts allow users to identify trends, view support and resistance levels, compare price movements, and track market changes through visual data representation.
Trading platforms also use custom charts to provide live updates, technical analysis tools, and personalized chart settings for different trading strategies.
Why Trading Charts Are Important for Trading Platforms?
Trading charts help users monitor market activity and understand price movement more clearly. They simplify complex market data into visual information that traders can analyze quickly.
A well designed chart improves the overall trading experience by helping users:
- Identify market trends
- Compare price movement
- Analyze historical market data
- Monitor volatility
- Apply technical indicators
Responsive and interactive charts also improve platform usability. If charts are slow or difficult to use, users may lose confidence in the platform experience.
Many traders use indicators like the Simple Moving Average to understand overall market direction.
SMA = (Sum of closing prices over a period) ÷ (Number of periods)
This indicator helps traders identify average price trends over a selected period of time.
Types of Trading Charts Available on Trading Platform
When you are building your own trading platform or customizing charts for users, every chart reflects the decisions you make about how price data should be understood.
Each chart type presents the same price data in a different way, helping traders understand trends, patterns, and possible future movements.
Choose chart types based on how much detail your platform supports and the trading styles of your users.
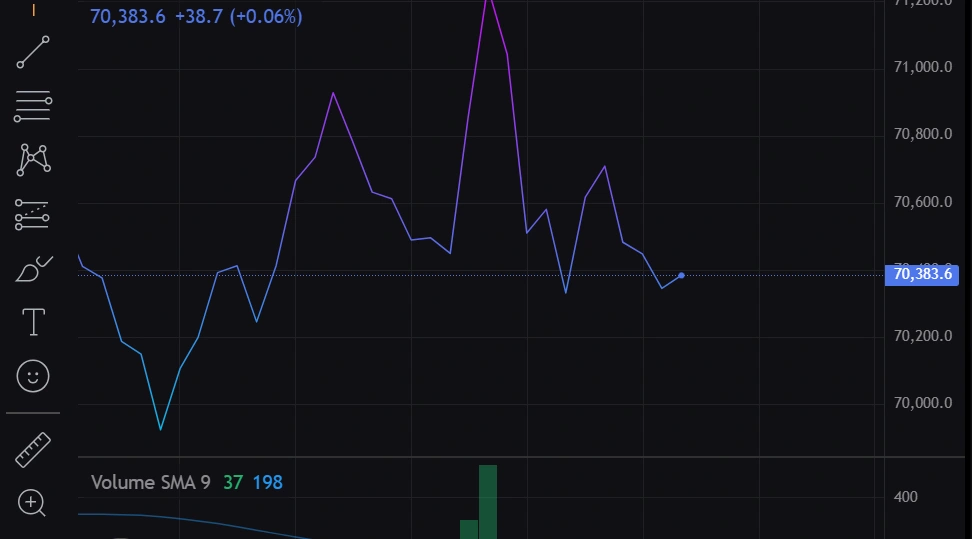
1. Line Chart
A line chart is the most basic structure you can offer. It only uses closing prices and connects them over time. From a development point of view, this is the cleanest transformation of data with minimal processing.
You can define its logic like this
“Take closing price at each interval → connect as a continuous path”
When a user opens your platform and selects this chart, what they see is simplicity. No clutter, no extra signals, just direction. It works well for dashboards, summaries, or users who only care about trend direction rather than detailed movement.
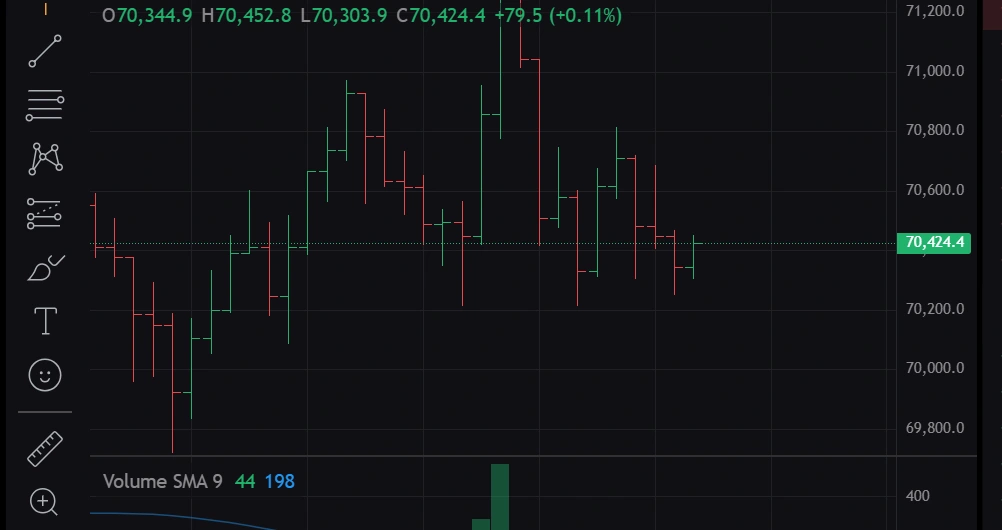
2. Bar Chart
A bar chart introduces more depth by using four data points per interval which are open, high, low, and close. Each bar becomes a compact data container.
You can think of its structure as
“One unit of time = one full price story”
From a platform perspective, this means mapping each interval into a vertical representation with clear extremes and boundaries. Users who choose this chart are usually looking for more than direction. They want to understand volatility and range within each time slice.
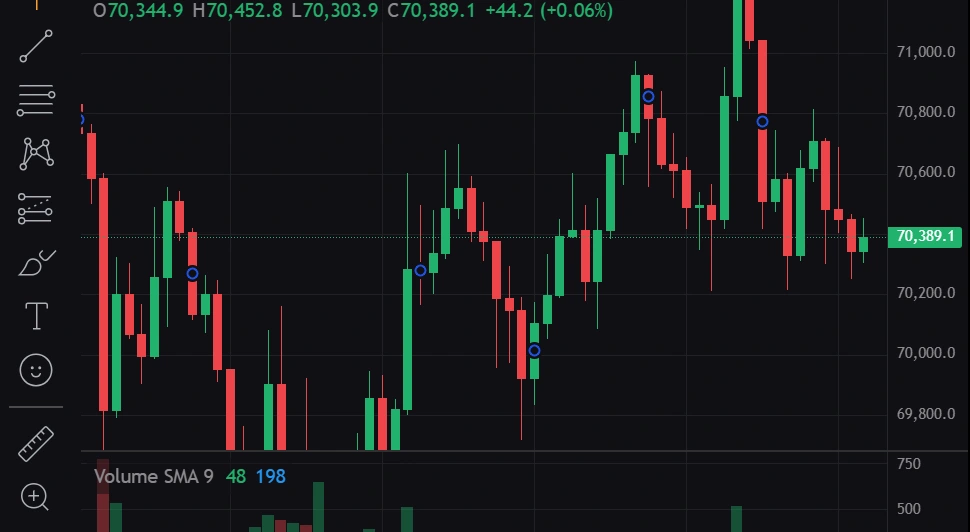
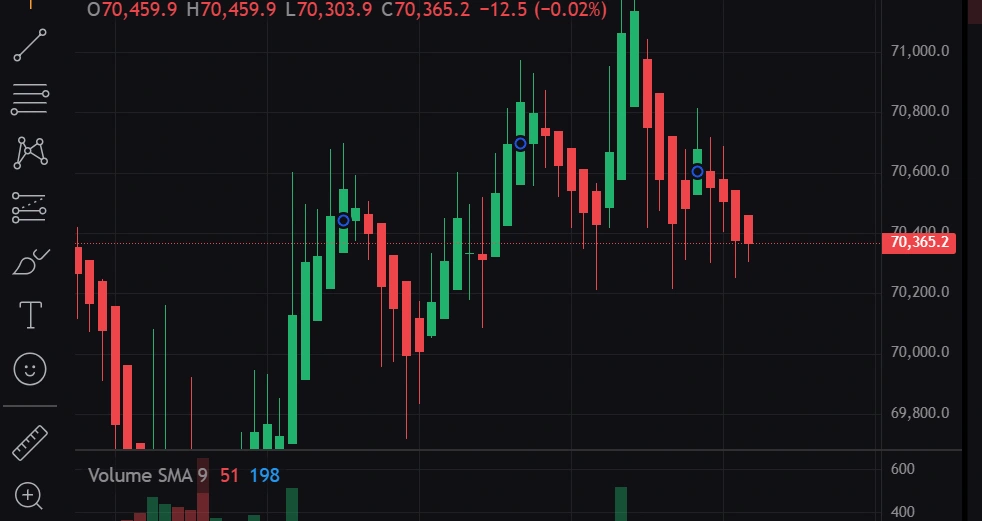
3. Candlestick Charts
Candlestick charts are widely used because they convert the same OHLC data into a more readable visual form. The difference lies in how the data is encoded using body and color.
The internal idea can be expressed as
“If close > open, highlight strength
If close < open, highlight weakness.”
When you implement this in your platform, you are not adding new data, you are enhancing interpretation. Users quickly scan colors and shapes instead of reading numbers. This is where design directly influences trading behavior.
4. Heikin Ashi Chart
Heikin Ashi charts are not a direct plot of raw data. They are derived values based on averaging. This makes them useful when you want to offer an alternative view that reduces noise.
The transformation logic can be summarized like this
“Modify current values using previous candle data to smooth direction”
For your platform, this means you are no longer just displaying data, you are generating a new dataset. Users who select this option are usually trying to focus on trend continuity rather than exact price points.
5. Renko Chart
Renko charts shift the focus completely from time to price movement. Time intervals become irrelevant here. What matters is whether the price has moved enough to justify a new block.
You can define the rule clearly
“If price change ≥ predefined size → create new brick
Else → no update”
From a system design perspective, this is event based rather than time based rendering. Your platform needs to wait for price thresholds instead of fixed intervals. This type of chart is useful for users who want to filter out small fluctuations.
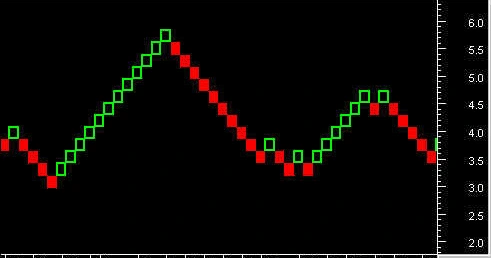
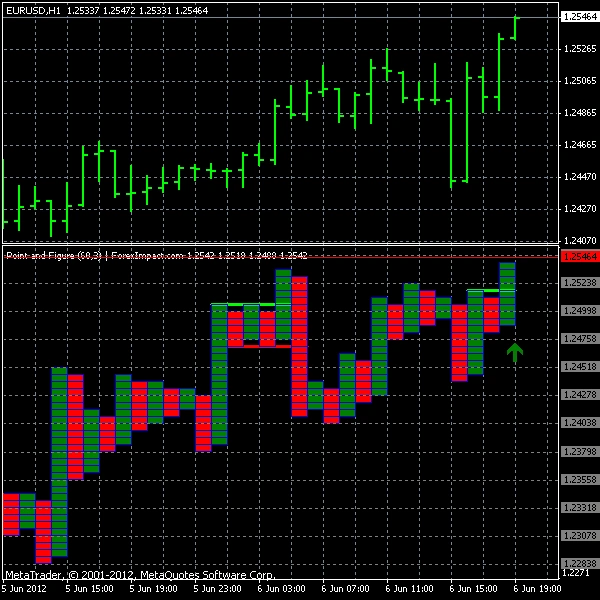
6. Point and Figure Chart
Point and Figure charts also remove the time factor and focus only on directional price changes. Instead of continuous plotting, they use symbols to represent movement.
The logic can be framed as
“Use X for upward moves
Use O for downward moves
Switch only after a defined reversal amount”
When you implement this, you are essentially building a rule based plotting engine. Users who rely on this chart are often looking for clear directional shifts without interference from minor movements.
7. Area Chart
An area chart builds on the line chart but adds a visual fill beneath it. While the underlying data remains the same, the presentation changes how users perceive magnitude.
You can describe its idea like this
“Take the line chart → fill the space below to emphasize movement size”
From a platform perspective, this is more about visual layering than new calculations. A user might look at it and feel
“The larger the filled space, the stronger the overall move appears.”
It is often used where visual impact matters, such as performance overviews or portfolio growth sections.
In the end, when you are designing or customizing charts for your platform, you are not just choosing chart types, you are choosing how users will think about the market.
Each chart is a different interpretation layer built on the same data. The better you understand these transformations, the more meaningful and flexible your platform will become.
Important Features Every Trading Chart Should Include
When you build or use a trading chart solution, the main goal is to help users understand price movements clearly and interact with the data easily.
A good chart is not just about showing lines or candles, it should allow users to explore, analyze, and make decisions without confusion.
Modern trading platforms need charting systems that are interactive, responsive, and simple to adjust for different trading styles.
Some key trading chart features include:
Real-Time Market Data
Trading charts should update continuously with live market data so users can see price changes as they happen.
Multiple Timeframe Support
Users should be able to switch between short-term and long-term intervals to study price movement across different periods.
Technical Indicators
Common indicators included in trading charts are:
- Moving Averages
- RSI (Relative Strength Index)
- MACD (Moving Average Convergence Divergence)
- Bollinger Bands
These tools help traders study price behavior and market momentum.
Drawing Tools
Drawing features allow traders to:
- Mark support and resistance zones
- Draw trend lines
- Highlight patterns on charts
Zoom and Pan Features
Clear zoom and navigation controls help users move across price history and focus on specific areas of the chart.
Multiple Chart Types
Platforms should offer different chart formats such as:
- Line charts
- Bar charts
- Candlestick charts
- Area charts
Fast Loading Performance
Charts should load quickly and respond without delay so users can view market changes without interruption.
Why Advanced Trading Charts Matter for Modern Trading Platforms?
Modern traders expect more than basic price graphs. They prefer interactive charts that support deeper customization, technical analysis, and clear market visualization.
Advanced trading charts improve platform usability by helping users:
- Understand price movement in a clearer way
- Study trends with less delay in interpretation
- Apply technical analysis in a more structured manner
- Interact with live market data in real time
Features like customizable indicators, multiple chart views, and real-time updates improve the overall trading experience and increase user engagement.
Many platforms now prefer custom trading chart solutions that support more control over settings, better performance under load, and richer visual interaction with market data.
How Trading Charts Are Integrated Into Trading Platforms?
Trading chart integration involves connecting market data with visualization systems that display information clearly for users.
The integration process generally includes the following steps:
Choosing the Chart Type
Select chart styles based on trading requirements and user preferences.
Connecting Market Data
Charts should connect with reliable real time or historical market data sources.
Implementing Technical Features
Add indicators, drawing tools, and customizable timeframes for better analysis.
Optimizing Chart Performance
Ensure charts load quickly and respond smoothly during user interaction.
Testing User Experience
Charts should be tested carefully for responsiveness, readability, and compatibility across devices.
Businesses often use custom charts solutions to integrate advanced charting systems into forex, crypto, and stock trading platforms.
Benefits of Advanced Trading Charts for Platform Users
Advanced trading charts provide several benefits for both traders and trading platforms.
Easier Market Analysis
Charts simplify complex trading data and make market trends easier to understand.
Better User Experience
Interactive charts improve platform usability and support smoother navigation.
Improved Data Visualization
Clear visual presentation helps traders analyze price movement more effectively.
Flexible Customization
Users can personalize chart layouts, indicators, and timeframes based on their trading preferences.
Faster Decision Making
Real time market updates help traders react quickly to market changes.
Increased User Engagement
Better charting experiences encourage users to spend more time using the platform.
Future Trends in Trading Chart Technology
Trading chart technology continues to evolve as modern trading platforms focus on improving speed, usability, and analytical capabilities.
Some growing trends include:
- Faster real time chart rendering
- AI based market analysis
- Advanced technical indicators
- Mobile optimized charting systems
- Interactive chart customization
- Multi asset chart comparison
As user expectations continue to grow, advanced charting systems remain an important part of building modern trading platforms.
Conclusion
Trading charts help users follow market movement and understand how prices change over time. Different chart formats offer different ways to study trends and patterns.
Platforms today are improving how charts respond to user actions, how data is displayed, and how information is organized on screen. Features like indicators, drawing tools, and live updates support better interaction with market data.
Charting systems will continue to be a core part of trading platforms as user needs expand.
Custom trading chart development from Hashcodex can support platform upgrades and new product ideas.
Connect with us to develop trading chart systems that match your product requirements.