
Planning to add TradingView charts to your broker platform?
Using TradingView charts is a quick way to provide traders with a professional charting experience. Since the charts are already built, so your development team can spend more time working on other important features.
But the real costs often show up after the integration.
As your platform grows, you may want more customization, new features, or updates to improve the trading experience. Making these changes can take extra time and increase costs.
Knowing about these hidden costs before you get started can help you make a better long-term decision.
In this article, we'll look at the hidden performance costs of using embedded TradingView charts.
What Are TradingView Charts?
TradingView charts are interactive financial charts that help traders track price movements, analyze market trends, and make trading decisions.
Think about the first thing a trader checks before placing an order.
It is usually the chart.
Whether they are trading stocks, forex, cryptocurrencies, or commodities, traders use charts to understand price movements, identify patterns, and study market behavior.
TradingView charts help traders understand the market better.
- They can choose different chart types.
- They can use technical indicators and drawing tools.
- They can switch between timeframes and look at historical price data.
These features help traders analyze price movements and customize their charts based on the way they trade.
Why Is TradingView Important for Broker Platforms?
A TradingView chart for business provides a familiar trading experience while reducing the time required to develop advanced charting features. This allows businesses to focus on other parts of their platform without compromising on market visualization.
Imagine opening a trading platform where there are no charts.
You wouldn't know whether a stock is moving up or down. You couldn't compare previous price movements or use indicators to analyze the market.
That's why charts are one of the most important parts of any trading platform.
By choosing TradingView chart integration, broker platforms can:
- Reduce initial development time
- Provide charting tools that traders already recognize
- Support technical analysis without building every feature internally
- Focus development efforts on trading workflows and business-specific features
These advantages explain why many startups and established brokers choose embedded TradingView charts during the early stages of platform development.
However, these benefits do come with their own costs and challenges
The Hidden Performance Costs of Embedded TradingView Charts on Broker Platforms
When comparing the cost of integrating trading charts, the hidden costs are not always part of the initial budget. But over time, they can become a significant part of the total investment.
The table below shows some common areas where broker platforms may spend more than expected.
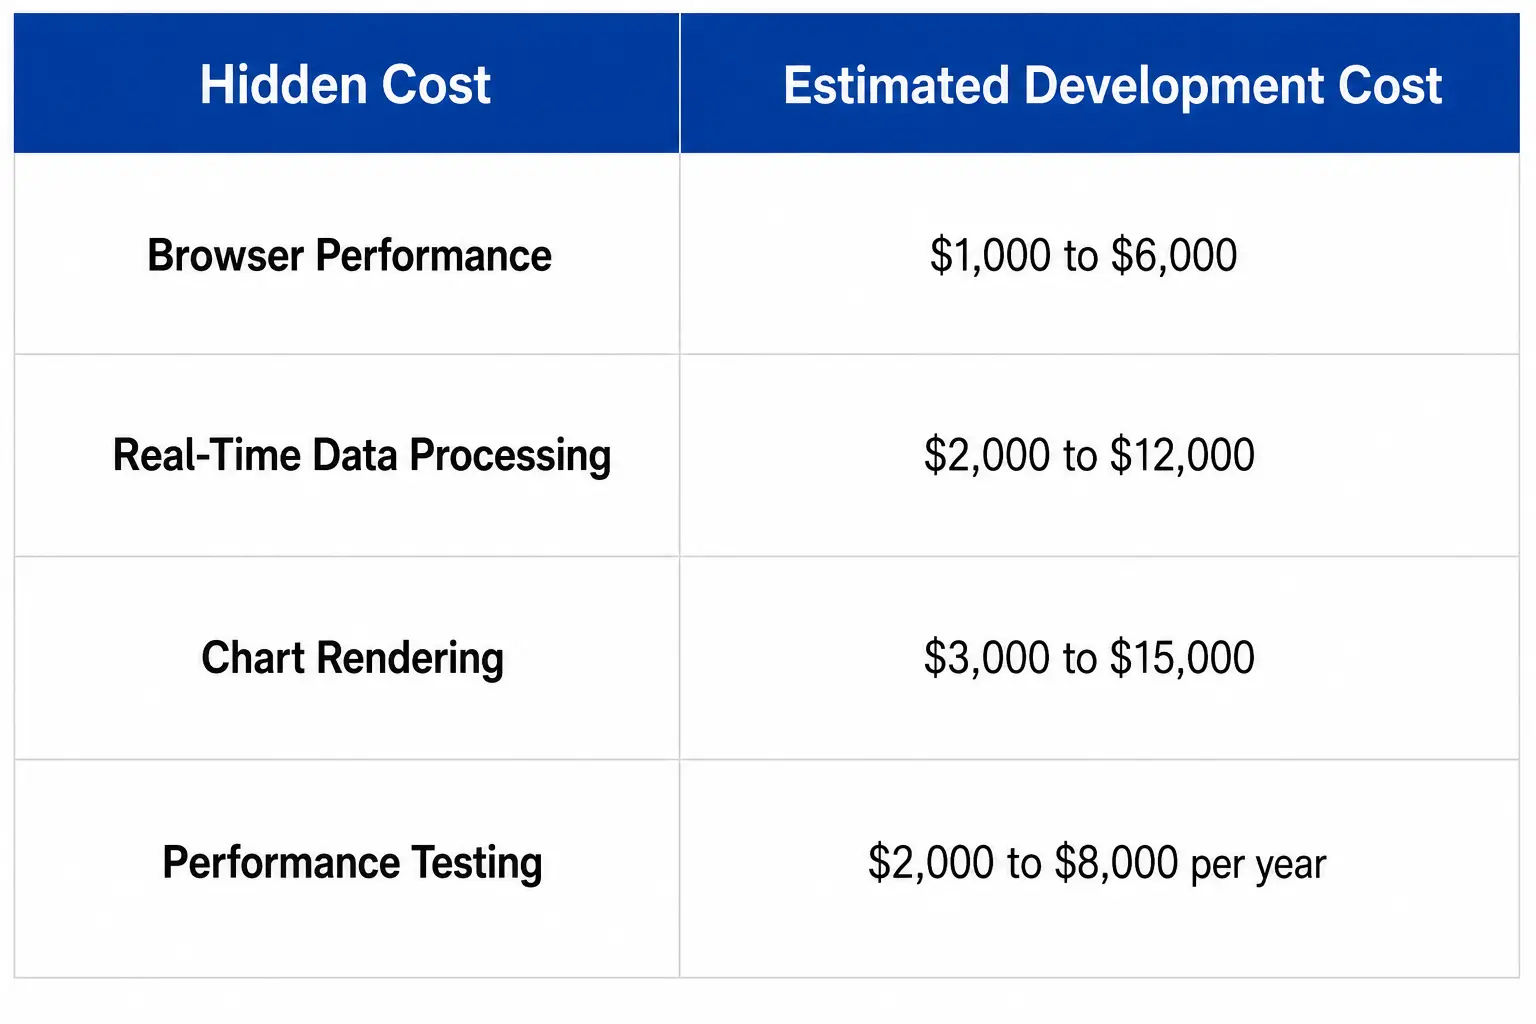
These are estimated development costs. Actual costs vary based on your platform, customization needs, and development rates.
Browser Performance
Every chart uses browser memory and processing power to display market data, indicators, and user actions. As traders open more charts or use more indicators, the browser has more work to do.
Without additional optimization, charts may take longer to respond or use more system resources than expected. Development teams often spend time improving how charts use browser memory and processing power.
Estimated development cost: $1,000 to $6,000
Real-Time Data Processing
Charts need a constant stream of live market data to display the latest prices.
As more traders use the platform at the same time, the amount of data being processed also increases. Development teams may need to improve how this data is received and displayed to reduce delays and keep charts up to date.
Estimated development cost: $2,000 to $12,000
Chart Rendering
As traders work with larger datasets, multiple indicators, drawing tools, and several chart windows, the browser needs to display much more information at once.
This can affect how quickly charts load and respond to actions such as zooming, scrolling, or switching between timeframes. Improving chart rendering often requires additional testing and development work.
Estimated development cost: $3,000 to $15,000
Performance Testing
Performance can vary across different browsers, operating systems, and devices. A setup that works well in one browser may not perform the same way in another.
To provide a consistent experience, development teams usually spend time testing charts under different conditions, finding performance issues, and making improvements where needed.
Estimated development cost: $2,000 to $8,000 per year
How Much Do These Hidden Costs Add Up To?
While every platform is different, these hidden expenses also influence the overall cost businesses consider when comparing custom trading chart solutions with embedded charting options.
Depending on your platform requirements and the level of optimization needed, businesses may spend an additional $10,000 to $50,000 or more during the first few years after launch.
Planning for these costs early helps broker platforms make better decisions about whether an embedded charting solution continues to meet their long-term needs and is a better fit.

How Embedded TradingView Charts Can Affect the Trader Experience
Adding TradingView charts to a trading platform can give traders a familiar way to view markets and analyse price movements. But there is another side to consider: how those charts actually feel to use inside the platform.
A few things can affect that experience:
→ Charts take time to load: If a chart takes too long to appear, traders may have to wait before they can start analysing the market.
→ Charts respond slowly: Changing timeframes, adding indicators, or using drawing tools should feel responsive. If there is a delay, even simple chart actions can become frustrating.
→ Market data appears late: Traders need current market information when checking prices. Delays can make the chart less useful for their trading decisions.
→ Multiple charts affect performance: A trader may have several charts, indicators, and tools open at the same time. This can put more demand on the browser and device.
→ The experience differs across devices: A chart may work well on a desktop but feel different on a phone or tablet. Brokers need to check how the embedded charts perform across the devices their clients use.
The key point is simple: adding a chart is only the first step. Brokers also need to see how traders experience those charts when they use the platform every day.
How Brokers Can Reduce Trading Platform Costs Without Compromising Performance
Reducing charting costs is not only about choosing a lower-cost solution. It is also about avoiding unnecessary development work, performance issues, and changes later.
Making the right decisions before and during integration can help brokers control long-term costs while building a better experience for traders.
Here are some practical ways to reduce future costs:
✔️ Start with the features traders need most
Launching with essential charting features first allows you to add advanced capabilities based on actual user needs.
✔️ Understand your requirements before choosing a solution
Knowing your expected users, markets, features, and customization needs early can help avoid costly changes later.
✔️ Work with developers who understand trading platforms
Trading platforms have unique performance requirements. Experience with these systems can help reduce unnecessary fixes and development time.
✔️ Plan for ongoing improvements
Charting needs can change as your platform grows. Including future updates and maintenance in your planning helps avoid unexpected costs.
✔️ Test performance before launch
Testing charts with different usage scenarios helps identify potential issues before they affect traders.
When Should Brokers Use Embedded TradingView Charts?
Before adding TradingView charts to a platform, brokers need to look at what their traders actually need and what the platform is expected to provide.
Embedded TradingView charts can be a good choice when:
→ Traders need more charting tools: If traders need indicators, drawing tools, different timeframes, and other charting options, TradingView can provide these without the broker having to build each tool from scratch.
→ Traders already know TradingView: If clients are familiar with the interface, they may find it easier to start using the charts without learning a completely new system.
→ Building charts internally would take too much development work: Creating a complete charting system requires time, developers, testing, and ongoing updates. Embedding an existing solution can reduce that development work.
→ The broker has checked the total cost: The cost is not limited to adding the charts. Licensing, market data, infrastructure, and ongoing maintenance may also need to be considered.
→ The charts fit the existing platform: Before making a decision, brokers should check how the charts work with their trading platform, devices, market data, and other tools.
Questions to Ask Before Choosing an Embedded Charting Solution
Before choosing an embedded charting solution, it is important to look beyond the initial setup. The right choice depends on your platform requirements, trader expectations, and the level of development effort you are prepared to handle over time.
Here are some key questions to consider before making a decision:
- How many charts will traders typically use at the same time?
- How much customization will the platform need in the future?
- How will the charting solution handle your market data requirements?
- How much control does your team need over the charting experience?
- How will performance be tested as your user base grows?
These questions can help you understand the long-term requirements of your charting solution and avoid unexpected development challenges as your platform grows.
Final Thoughts
Saving time at the beginning is useful, but planning for the future is what keeps your trading platform moving forward.
Embedded TradingView charts can be a great starting point for broker platforms, but businesses need to look beyond the initial integration. Performance requirements, customization needs, and ongoing maintenance can add unexpected costs as the platform grows.
The right investment is not always the cheapest option. It is the solution that fits your platform needs, reduces unnecessary development work, and can support your plans as your business grows.
Hashcodex understands the challenges businesses face while building trading platforms. We provide custom trading charts and trading solutions that help fintech companies create charting experiences based on their requirements.
Get in touch with us today and build a trading chart solution that supports your platform growth.
Frequently Asked Questions About Embedded TradingView Charts
What are the hidden costs of embedded TradingView charts?
The hidden costs can include licensing, market data, infrastructure, development, maintenance, and performance related expenses. The total cost depends on how the charts are used and how they are connected to the trading platform.
How much does it cost to embed TradingView charts?
The cost of embedding TradingView charts depends on licensing requirements, data usage, integration work, infrastructure, and the features the broker needs. There is no single cost that applies to every brokerage.
Do embedded TradingView charts affect platform performance?
Yes, embedded TradingView charts can affect platform performance, especially when traders use multiple charts, indicators, and drawing tools at the same time. The impact also depends on the platform setup, browser, device, and how the charts are integrated.
Should brokers embed TradingView charts or build their own charts?
Brokers should compare development time, features, costs, maintenance, and control before choosing between embedded TradingView charts and a custom charting system. Embedding an existing charting solution may reduce development work, while building a custom system can give the broker greater control over the charting experience.









 NDA on Request
 Free Consultation – Let’s discuss your ideas